Oceanic Thermocline Energy Harvesting with PCM Thermal Engine in AUV Applications
Contributors: Matthew Galarza and Haonong Du
Introduction
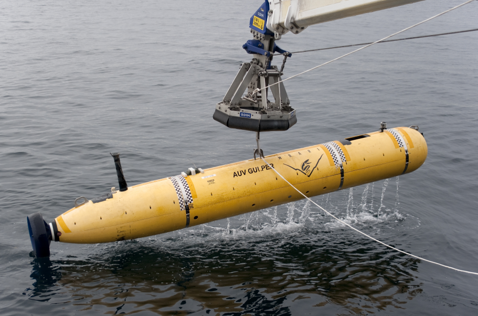
The ocean is our largest and greatest resource, covering around 71% of the Earth's surface and containing 97% of the Earth's water. Although our largest resource, much of the ocean floor is unmapped, pushing mapping efforts AUVs or unmanned underwater vehicles are the devices tasked with this underwater exploration and mapping effort. An evolution from the remotely operated vehicles or ROVs, which require a tethered connection to a service vessel, AUVs have no physical connection to an operator. An example AUV can be seen in Figure 1 below. As the name suggests, AUVs operate based on initial commands and execute orders autonomously. Various equipment for sampling and surveying such as sonar, cameras, and depth sensors assist in oceanic mapping. The advantages of AUVs are desirable for ocean-based research purposes as well. The lack of human or tethered elements allows for deeper and more versatile movements underwater for extended periods of time. Once submerged, AUVs are protected from harsh surface-level weather conditions and don't require constant attention. They can also be tailored to project-specific requirements, with scalable or modular aspects such as sensor and data software needs.
The major challenge in AUV construction is the component tasked with providing power to the device. AUVs are generally equipped with a battery pack for power supply, however, the battery capacity limits device endurance and sailing range. As a result, the utilization of marine environmental energy has gained traction as a way to improve sailing range and endurance. The original idea proposed by Douglas Webb and Henry Stommel in the 1990s proposed energy harvesting through ocean thermoclines, the temperature gradient of ocean water with depth. The goal was to convert the thermal energy between the warmer surface and the colder depths to drive the buoyancy changes of the vehicles. The operation of a thermal engine revolves around a phase change material (PCM), with a solidification temperature that lies between the AUV descent range. A piston structure thermal engine shown in Figure 1 below demonstrates the basic operating principles.
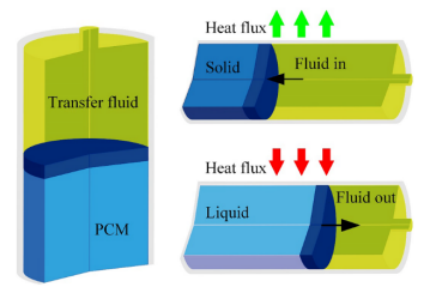
The thermal engine shown above is an early model that mimics a piston-cylinder construction. The piston is represented by the PCM and is separated from the transfer fluid by an adiabatic rubber section. As the thermal engine moves from a high-temperature region to a low-temperature region, heat flux will flow out from the thermal engine. As this process occurs, the PCM will solidify and contract, creating a pressure difference and forcing transfer fluid into the engine. The reverse process will occur when moving from a low-temperature region to a high-temperature region, forcing transfer fluid out of the engine as the PCM liquifies. This thermal process can then be paired with an accumulator to create a buoyancy cycle that drives AUV sailing, illustrated in Figure 2 below.
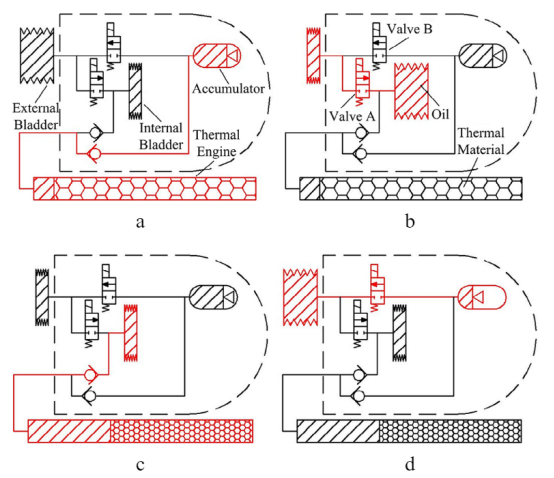
During operation, AUVs have four distinct modes. At the start of the process shown in Figure 3(a), the AUV is floating at the water's surface, with the external bladder inflated to provide positive buoyancy. To initiate the descent stage, the solenoid valve A opens, and the external bladder empties the transfer fluid into the internal bladder which creates a negative buoyancy on the glider. As the glider descends, the PCM begins to solidify from the decreasing ambient water temperature provided by the thermocline. The volumetric change incurs a pressure difference and pulls transfer fluid through a check valve into the thermal engine as shown in Figure 3(c). Once sufficient data is collected, the accumulator full of pressurized fluid inflates the external bladder and begins the ascent stage illustrated by Figure 3(d). The melting of the PCM as the glider ascends due to positive heat flux, pressurizes the engine and forces the transfer fluid into the accumulator. This returns the AUV cycle to the initial state and prepares for the next operation cycle.
The objective of this project is to design and model an improved thermal engine for AUV applications utilizing a phase change material (PCM) for ocean floor mapping. The requirements for the thermal engine put forth by Rensselaer Polytechnic Institute were to achieve a minimum hydraulic work of 3.5 kJ produced by the thermal engine, minimize the cost of thermal engine construction, and design for manufacturability. Literature AUV designs do not focus on improving PCM solidification and melting efficiency which slows oceanic mapping progress. To combat this, a novel thermal engine shell will be designed featuring internal fins. The design will account for shell material and PCM selection as well as justification of fin geometries and locations. The designed thermal engine will compare analytical and modeling results to prove modeling accuracy. Furthermore, a parametric study will benchmark original model results to variability in fin geometries, optimizing thermal engine construction and cost.
Thermal Engine Design and Performance
The thermal engine is designed to function within a 1000 m depth range and produce sufficient hydraulic work in one cycle. The total length of the cylindrical metal shell is 1.2 m, with an external diameter of 76 mm and an internal diameter of 70 mm. The transfer fluid will be separated from the PCM by an adiabatic rubber cylinder with an initial stage diameter of 22 mm. This PCM engine design was chosen after a literature review of current AUV thermal engine technology. The analysis will assume an average descent and ascent velocity of 10 cm/s to prevent inconsistency in the analytical calculation. During operation, the cylinder will be assumed to be oriented axially to fluid flow rather than in cross flow which will allow for more dimension variability. A shell with no fins will be taken as a benchmark while designs with internal fins are taken as optimization groups. The material of the metal shell selected is 316 stainless steel due to its durability and relatively low cost. Other materials considered such as titanium and aluminum alloys had higher manufacturing costs and lower durabilities, respectively. The thermal conductivity of 316 stainless steel is also very competitive with other materials and is sufficient for functioning as the heat exchanger shell.
Currently available PCMs have solidification temperatures at various points along the thermocline range. These phase change materials are compared in Table 1. Considering the working environment with a surrounding temperature range of 4C to 25C, the suitable phase change materials would be Hexadecane (C16H34) and Pentadecane (C15H32).
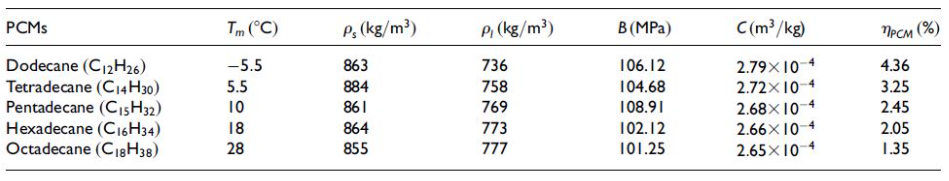
In normal cycle operation, the temperature differences of both phase change materials would be equivalent. As the higher phase change temperature would benefit descent solidification while taking longer to melt during ascent, a lower phase change temperature would take longer to solidify during descent and melt faster on ascent. After data collection, many gliders remain at the surface for some time to transmit collected data. As a result, a higher phase change temperature would be ideal to improve solidification temperature while the downsides during ascent are mitigated by the required transmission time. Therefore, Hexadecane was chosen as the PCM material.
The specific density of liquid and solid phases varies at different temperatures as shown in Equation 1. In this study, we chose the specific density of PCM at the temperature of 17.2 °C. The specific density of the liquid PCM is 1.2907 cm3/g, and the specific density of the solid PCM is 1.1574 cm3/g. The latent heat of C16H34 is 238kJ/kg, and the thermal conductivity of solid-phase PCM is 0.21298 W/(mK). As discussed above, at the start of the initial phase, the adiabatic rubber shell is 22 mm which allows us to calculate the total mass of the PCM in the thermal engine. The total mass of PCM is 3.2246 kg.
To generate an accurate temperature profile with water depth, South China sea data was utilized from literature. Functions for different depth periods are created according to the oceanic thermocline data shown in Figure 4 below.
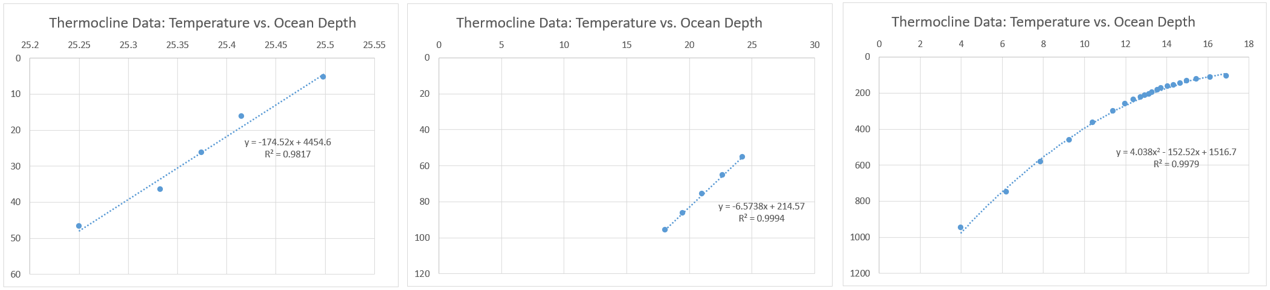
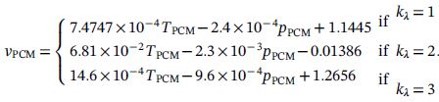
Although having reasonable R squared values, having three separate functions is impractical and could cause error at points when they transition. Therefore, a combined function is used. The function utilized is found by Equation 2 below and substitutes glider velocity to provide a function of temperature with depth.

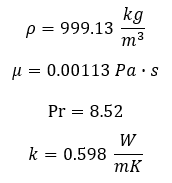
The coefficient of heat transfer for forced convection between shell's wall and seawater requires calculation. As the AUV descends, flow is assumed to be axial to the cylinder shell, so the contact surface is approximated as a long flat plate in the convection model. The average properties of seawater for the specific temperature range is shown below.
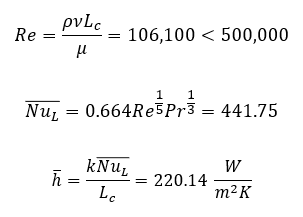
In order to calculate the convective coefficient, h, the Reynolds number is calculated for external flow by Equation 3 shown below. Given our values for Prandtl and Reynolds numbers, the Nusselt number correlation for a flat plate shown in Equation 4. It can be seen that the calculated Reynolds number is within the laminar region, an unlikely outcome in real-world turbulent ocean currents. This, however, is not of concern as a laminar boundary layers provide decreased coefficients of heat transfer, and therefore our analysis will take into account worse-case conditions. The corresponding convection coefficient can then be calculated by Equation 5.
The total heat transfer during the descent stage can be calculated using Equation 6. The total heat transfer is 887.776 kJ. To make a simplified model, a node on the inner surface is taken into calculation. The average heat flow rate is then calculated using Equation 7.
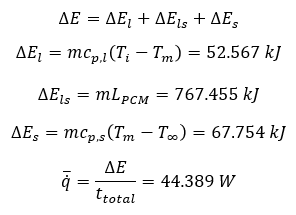
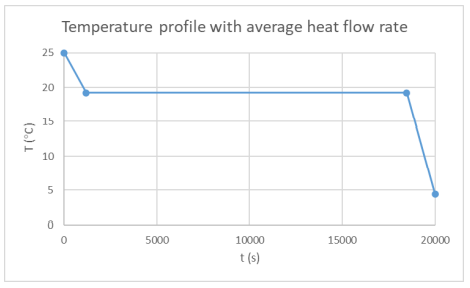
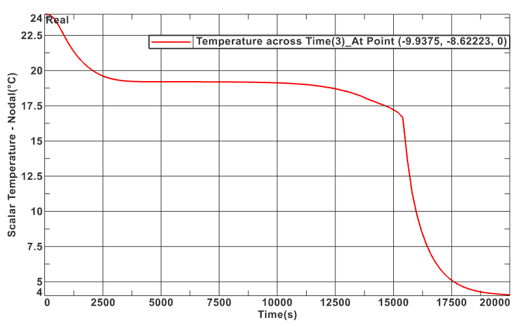
Assuming the heat flow rate is constant during the entire descent stage, the temperature at the inner surface can be illstrated by Figure 5 below.
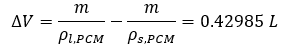
To calculate the available hydraulic work, the total volumetric change of PCM during the cycle is needed. The corresponding density of liquid and solid PCM is 0.77477 g/cm3 and 0.86401 g/cm3, respectively. The total volumtric change can be calculated in Equation 8 below.
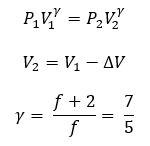
The accumulator is designed to be covered with a thermal isolation material. The compression and expansion of nitrogen in the accumulator is therefore considered an adiabatic process and nitrogen is considered to act as an ideal gas. The pressure and volume of gas adheres to the relationship shown in Equation 9 below. The volumetric changes of the gas can be found in Equation 10. The adiabatic constant, gamma, is the ratio of specific heats for a gas that is dependent on the effective degrees of freedom in molecular motion. This is shown in Equation 11. For Nitrogen, the degrees of freedom, f = 5.
The hydraulic work for the adiabatic process can be determined by Equation 12 below.
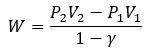
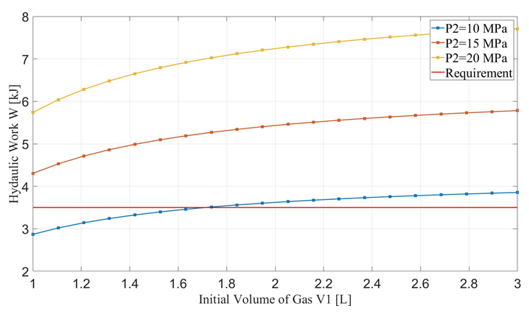
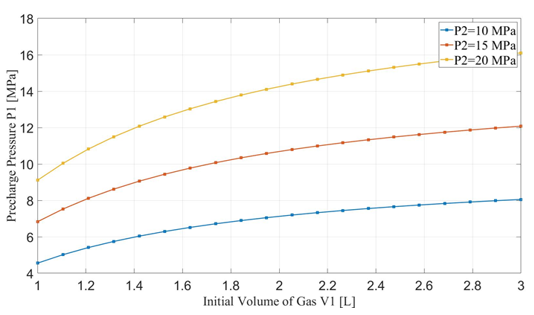
The maximum designed gas pressure in the accumulator is 20 MPa. Since the minimum gas volume, V2, is related to the initial gas volume, V1, the hydraulic work is dependent upon the initial gas volume in the accumulator when the compression cycle ends with its associated maximum pressure, P2. Figures 6 and 7 show the relationship between hydraulic work and the requirement of pre-charge gas pressure, P1, to the initial gas volume in the accumulator. For a specific maximum pressure reached at the end of the cycle, higher initial gas volume leads to greater hydraulic work but requires higher pre-charge gas pressure. The rate of increase of hydraulic work slows down after the initial gas volume exceeds 1.5 L. On the other hand, increasing the maximum pressure could significantly raise the hydraulic work but also the required pre-charge pressure. For P2 > 15 MPa, the hydraulic work can easily exceed the required 3.5 kJ in one cycle.
Thermal Engine FEM Simulation
The Finite Element Modelig (FEM) simulation of the thermal engine is conducted with NX. Due to the limited calculation capability of available processing computers, a thin slice (0.12 mm) is cut from the thermal engine for the simulation to acquire a very fine mesh on the cross-section. There is no axial or angular heat transfer, so the thin slice model is representative of the heat transfer within the thermal engine.
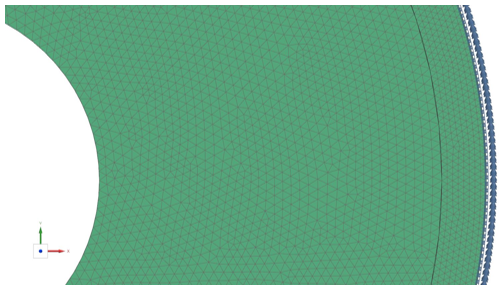
The material of the shell is 316 stainless steel as discussed earlier. The material of PCM is defined according to the properties of Hexadecane (C16H34). The thermal flow simulation in NX is not capable of modifying mesh size during the phase change process, therefore, the mesh is fixed with a constant density of PCM for this simulation. The phase change temperature, latent heat, and specific heat capacities for pre and post phase change function as designed in the simulation. The mesh shaped selected are 4-noded tetrahedral elements with a 0.5 mm average mesh size. The PCM part has a mesh element number of 60653 and the shell part has a mesh element number of 26234. A sample of the mesh is shown in Figure 8 below.
The boundary conditions for the top and bottom surface of the slice are set as adiabatic due to no axial or angular heat transfer. The contact interface of the PCM and shell is set as perfect contact. The outer surface of the shell is applied with the constant convection coefficient calculated above as h = 220 W/(m2K). The initial temperature is uniformly 25C. As for the surrounding temperature, the time-based temperature profile is applied. This is shown in Equation 13. The solution time interval is from 0 to 20,000 seconds. There are 2000 calculation steps and 200 result samples in total.

The temperature profile within the thermal engine is acquired from the simulation. Figures 9a shows the temperature distributions at the corresponding times of 0 seconds, 5,000 seconds, 10,000 seconds, 15,000 seconds, and 20,000 seconds. At t = 0 seconds, the model is uniformly 25C. Phase change occurs near the outer layers in PCM at t = 5,000 seconds. At t = 10,000 seconds, most of PCM has changed phase. The liquid phase of PCM remains in very thin layers near the center around t = 15,000 seconds. At the end of simulation, t = 20,000 seconds, all PCM has solidified and the overall temperature has settled at a value consistent with ambient temperature. A simulation result can also be seen in Figure 9b.
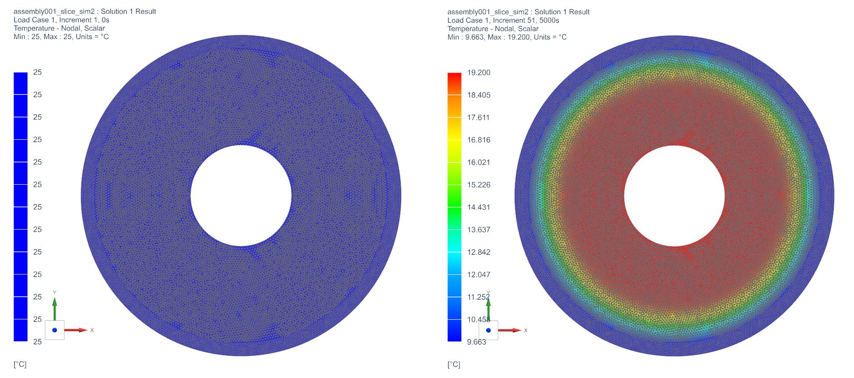
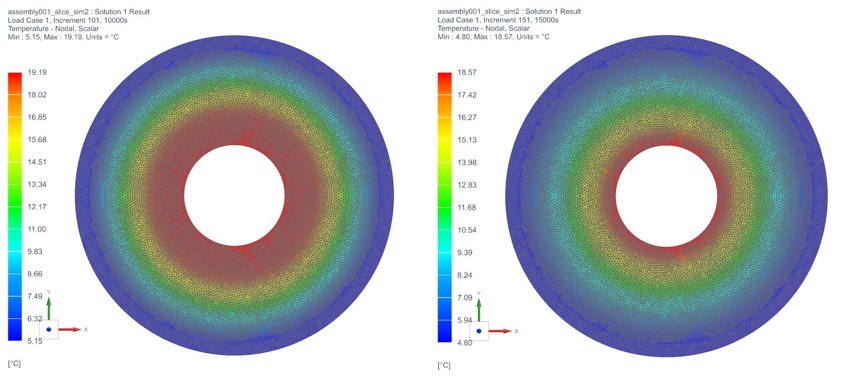
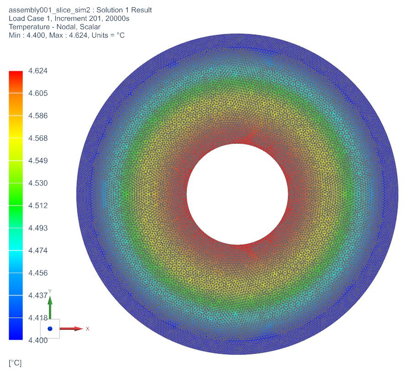
Figure 9b: Active Thermal Engine Simulation
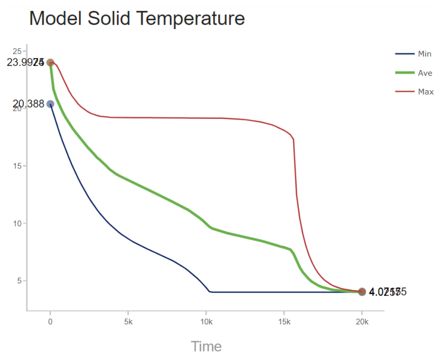
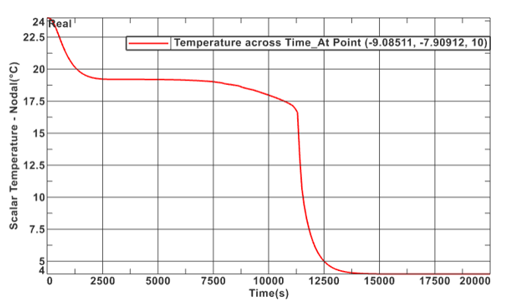
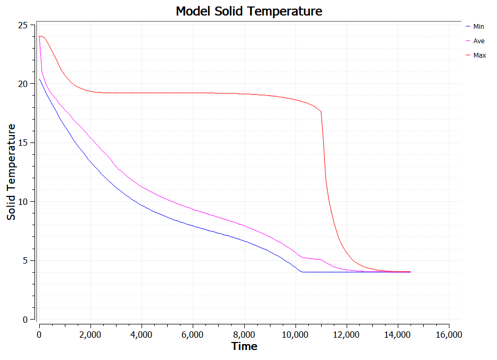
A temperature profile of an inner node during the simulation was taken to provide further insight into the solidification process. This plot is shown in Figure 10 below. During the initial descent, the temperature profile stays relatively linear until ~100 meters, where it shifts to a linear path with a greater slope. This is shown by the transcient response of 0 to 5,000 seconds. At this point, the simulation and material properties play a larger role. As stated previously, the simulation cannot adapt to phase change. This does not affect steady state solutions, however, this does shift the transcient response of the plot. Between 5,000 and 12,500 seconds, the PCM temperature appears to stall as the temperature profile becomes less concentrated and heat flows from the inner section, where the node selected is located, towards the outer section. This occurs because the heat flows from the centerline to the exterior shell, hence, the outer layers of the PCM would achieve solidification temperature before the inner sections. Once the inner layer of nodes reaches solidification temperature, at ~ 15,000 seconds. The entire PCM fluid phase changes all at once. This is what causes the immediate decreasing transcient temperature profile. This is further justified by Figure 11 which illustrates the variability of temperatures with time of the PCM nodes.
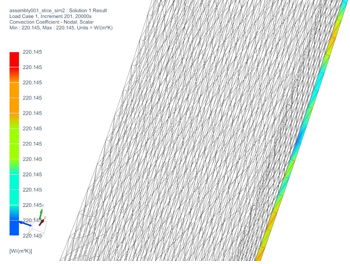
To validate the heat convection coefficient calculated in theoretical analysis, a simulation is conducted to determine the forced convection coefficient calculated by NX. Figure 12 shows the convection coefficient calculated by the software. The averaged convection coefficient calculated by NX under forced convection is h = 220.145 W/(m2K), which is very close to analytical calculations. Therefore, analytical values can be considered to be valid.
Optimization of Thermal Engine
As discussed previously, the proposed thermal engine improvements will focus on descent solidification efficiency. This resulted in the PCM selection of Hexadecane as it has the highest phase change temperature of considered PCMs. The proposed design will feature internal fins as opposed to external fins for a few reasons. In order to benchmark and determine accuracy of simulation results, the convective heat transfer coefficient was compared with analytical calculation through literature review as discussed above. If external fins were used, analytical calculation for each optimization group would have to be calculated to ensure simulation accuracy. The removal of external fin variation prevents calculation error that could arise from multiple trials. Secondly, external fin changes would vary the drag on the AUV. The high variation of drag force created by fin geometry variability would make it difficult to justify a constant velocity of the glider. Furthermore, AUVs typically operate with multiple thermal engines. As a result, thermal engines with exterior fins require more space to prevent tolerancing issues and would likely require AUV redesign, an aspect we want to avoid. As discussed briefly in chapter 1, the final reason for interior fins was to increase the surface area with the PCM. Thermal engines may suffer from uneven phase change if the volume of a particular region is too far from the solid boundary layer, as a result, as fins increase inward they provide two benefits: reduce the chance of uneven phase change and increase the heat flux of the PCM.
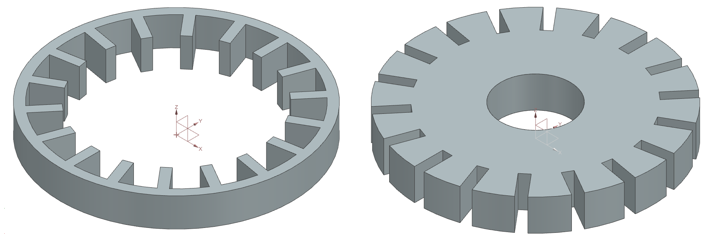
Similar to the benchmark model, the simulation will be done by concentric cylinders featuring the internal fin cuts as shown in Figure 13 below. The simulation will include both large sections and slices to allow for a greater mesh size and increased accuracy. An example of the model is shown in Figure 12 below. The model will feature a shell and PCM geometry similar to benchmarking simulations.
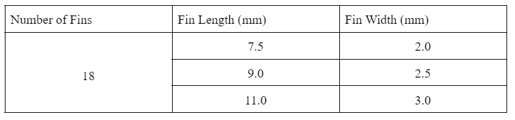
The analysis methodology will focus on three separate fin dimension variables: fin length, fin width and the number of fins. In order to avoid too much variability, the number of fins was kept constant. As the number of fins increase, the time decreases proportionally, this however, decreases the amount of PCM in the given thermal engine geometry. This change would require an increase in exterior engine diameter which is far more significant than the changes associated with fin geometry. As a result, a total of 18 fins is held constant for all trials. The parametric study conducted wanted to determine the effects of the specified variables on the PCM solidification time. The variables chosen can be seen in Table 2 below. A total number of nine trials were conducted to determine the effect on solidification time.
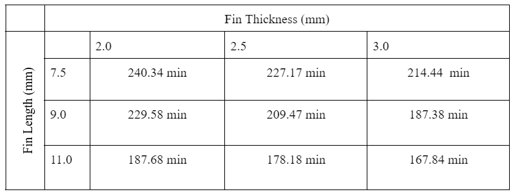
The solidification time for the benchmark thermal engine was 246.17 minutes and was compared with finned thermal engine results found in Table 3 below. These results are plotted in Figure 14, where percent improvement is the difference between baseline solidifcation to that of optimized fin solidification time.
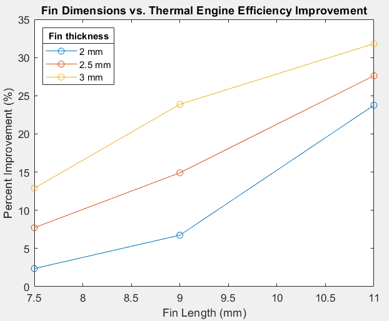
A few trends can be determined from this study. First, the fin length has a greater effect on reducing solidification time compared to fin width. This is likely caused by reducing the thickness of the PCM between the edge of the fin and the center rubber section. In contrast with the fin width, the increase in length exposes the PCM center to greater contact with the shell exchanger. This is futher confirmed by the reasoning for stalled transcient temperature profiles of inner nodes. Reducing the distance between these sections, decreases the stall time between transcient states. This differnce can be seen in Figure 15 and 16 below. In Figure 16, the average node temperature is significantly closer to the minimum temperature plot compared to that of the baseline test shown in Figure 11, further adding to previous justification and analysis. The greatest improvement resulted from a fin geometry of 3 mm x 11 mm and provided a solidification time 31.82% better than the baseline PCM engine. The active simulation of this fin geometry is shown in Figure 17 below.
Design for Manufacturability
Manufacturability is another key point of the design process. In order to facilitate ocean mapping research, more AUVs are needed, a potentially costly investment. As such, thermal engine manufacturing costs must be kept low while also ensuring build quality is enough to withstand operating conditions. Investment casting, also known as precision casting was selected as the ideal manufacturing method for this project as it is industry standard for 316 stainless steel and does not require changes after initial investment. In this manufacturing process, a wax pattern is used to shape a disposable ceramic mold. A wax pattern is made in the exact shape of the item to be cast. This pattern is then coated with a refractory ceramic material. This process can be visualized in Figure 18 below.

To begin the process, wax molds are produced from aluminum. The simplistic design of the thermal engine does not require complex machining techniques for this process. Once the molds are complete, wax is injected into the cavity, which is removed when solidified. After removal, the molds are joined with the assembly in a process known as tree assembly. This is typically for smaller parts, however, the thin cylinders do not require a lot of space and can be fit side-by-side in this arrangement. At this stage, the ceramic shell can now be built. To build the shell, the assembly is dipped in a colloidal silica coating which is then sprinkled with fire-resistant sand. The coating is then dried and repeated multiple times until the ceramic shell is finished. The final stage before pouring is dewaxing. The assemblies are placed in a large oven where the wax is melted and removed from the interior. After this stage, the steel casting can be completed. Once cooled, the thermal engine shells are removed from the assembly, known as cutoff, and then finished. The final stage would be the domed steel caps for the shells. These can be created by hydraulic pressing in a process known as blanking.
Conclusion
In this study, the previous work on AUV designs was reviewed to provide a reference geometry. Analytical and simulation benchmarking provided initial values that were validated through convection coefficient literature review. Parametric models of internal fins were tested in NX and results were compared to benchmark tests providing insight into geometric trends. Available hydraulic work from the thermal engine is plotted in multiple working environments and suggestions on pressure and volume of gas in the accumulator are provided. The following conclusions can be drawn.
1. Hexadecane (C16H34) is chosen as the phase change material in our thermal engine design due to its melting temperature and density change rate between liquid and solid phase. The disadvantages of the selection are mitigated by necessary data transmission time.
2. The shell material was selected to be 316 stainless steel for its lower material and manufacturing cost as well as the durability in seawater.
3. The external fins design is not considered in this study since extra fin area in fluid may greatly affect the descending/ascending velocity.
4. Internal fins design are adapted as it can increase the heat transfer surface area and shorten the total time to reach equilibrium state in descent/ascent stage.
5. The maximum available volume change of PCM is 0.43 liters. With the maximum designed gas pressure larger than 15 MPa after compression in the accumulator, the available hydraulic work easily exceeds the required 3.5 kJ in one cycle.
6. Considering building cost, the accumulator that can contain around 1.5 liters pre-charge nitrogen at initial state could be a more economic option.
References
[1] US Department of Commerce, NOAA, National Weather Service. (2014). NWS JetStream - Layers of the Ocean. Weather.gov. https://www.weather.gov/jetstream/layers_ocean
[2] Zhang, H., Liu, C., Yang, Y., & Wang, S. (2020). Ocean thermal energy utilization process in underwater vehicles: Modelling, temperature boundary analysis, and sea trail. International Journal of Energy Research, 44(4), 2966-2983. https://doi.org/10.1002/er.5123
[3] Yang Y, Wang Y, Ma Z, Wang S. A thermal engine for underwater glider driven by ocean thermal energy. Appl Therm Eng. 2016;99: 455-464. https://doi.org/10.1016/j.applthermaleng.2016.01.038.
[4] Peng, Hanbang & Pan, Aijun & Zheng, Quanan & Hu, Jianyu. (2017). Analysis of monthly variability of thermocline in the South China Sea. Chinese Journal of Oceanology and Limnology. 36.10.1007/s00343-017-6151-0.
[5] Wang, G., Yang, Y., & Wang, S. (2020). Ocean Thermal Energy Application Technologies for unmanned underwater vehicles: A comprehensive review. Applied Energy, 278, 115752. https://doi.org/10.1016/j.apenergy.2020.115752
[6] Wang, G., Ha, D. S., & Wang, K. G. (2019). A scalable environmental thermal energy harvester based on solid/liquid phase-change materials. Applied Energy, 250, 1468-1480. https://doi.org/10.1016/j.apenergy.2019.05.100
[7] Wang, G., Ha, D. S., & Wang, K. G. (2018). Harvesting environmental thermal energy using solid/liquid phase change materials. Journal of Intelligent Material Systems and Structures, 29(8), 1632-1648.
[8] US Department of Commerce, N. O. and A. A. (2017, May 24). Why should we care about the ocean? NOAA's National Ocean Service. Retrieved April 25, 2022, from https://oceanservice.noaa.gov/facts/why-care-about-ocean.html#:~:text=The%20air%20w e%20breathe%3A%20The,our%20climate%20and%20weather%20patterns.
[9] What is an AUV? What is an AUV? : Ocean Exploration Facts: NOAA Office of Ocean Exploration and Research. (n.d.). Retrieved April 25, 2022, from https://oceanexplorer.noaa.gov/facts/auv.html